Price Action is one of the most common approaches to forex trading, unlike fundamental analysis – price action trading is about making trading decisions based on price movements alone and without heavy reliance on indicators.
The most effective price action strategy is the approach grounded in multi factor trade decision making framework – this is what this post will demonstrate using real forex market chart scenarios and analyses.
The trading approach is beginner friendly because it keeps the workflows and charts clean. The approach is also effective and highly scalable for forex, indices as well as CFDs.
NOTE: This approach only works well and yields meaningful results when it is backed by a consistent and disciplined risk management.
In this post I will explain how price action works and dumb it down to 5th grade level. I will simplify price action trading to 5 critical aspects:
The 5 Critical Factors of Your Price Action Trading Strategy
I will use real time charts I have used in some trades to demonstrate critical principles of price action trading.
For clean, responsive charts — I use TradingView Free with EMAs and volume indicators. Also, my trades are executed with Pepperstone for tight spreads and low latency.
Step 1: Identify the Dominant Trend
The first task of a price action trader is to identify the dominant trend. One of the common reasons why about 90% of beginner traders lose money is trading against the dominant trend.
Forex trading is all about probability – every decision is a risk – so successful trading is about taking decisions with high probabilities of success. You may still lose some positions – but if your strategy is solid and risk management disciplined – you will win more money when you win and lose less when you lose.
Trading in the direction of the dominant trend increases the positive prospects of your position as there are less chances of the price going against your profitable position – even if it does there may be pull packs on reversals – these may be short-lived or counteracted by risk management.
To check the dominant trend focus on this time frames:
Timeframes to Check
The graph below illustrates how to select a chart period in TradingView
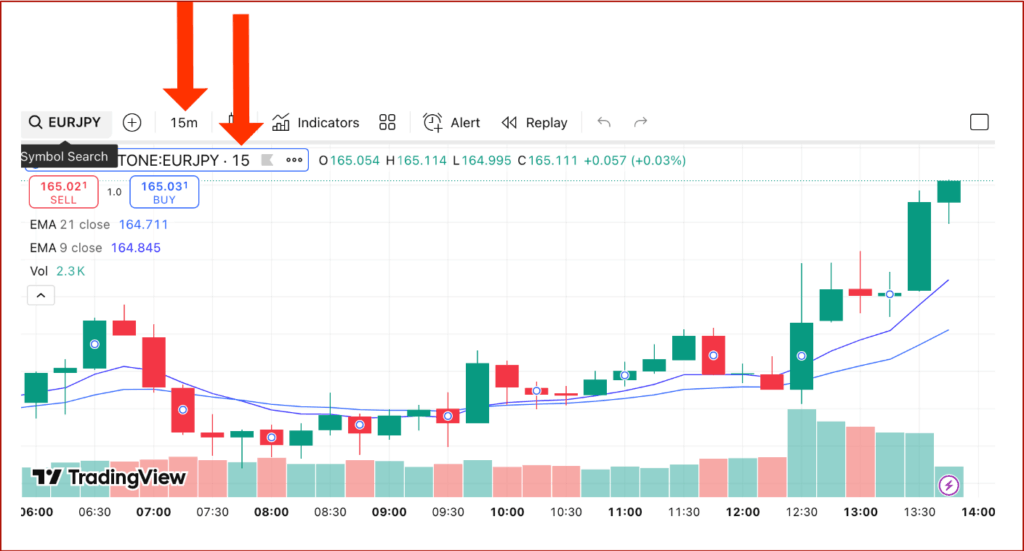
After clicking on the chart period label (e.g. 15m on the graphic) you will then get a dropdown of different time frames to choose from. Different trading platforms have different options – and some options are locked to paid plans – but the basic TradingView plan (free) has sufficient chart period options to make the right decisions.
How to Read it the Chart for Dominant Trend
To read the charts you will need to make use of two important indicators – the exponential moving average (EMA) 9 and EMA 21 – 9 and 21 represent the chart periods.
- Use EMA 9 and EMA 21 crossover and spacing
- If EMA 9 is above EMA 21 with good distance → bullish bias
- If EMA 9 is below EMA 21 with good distance → bearish bias
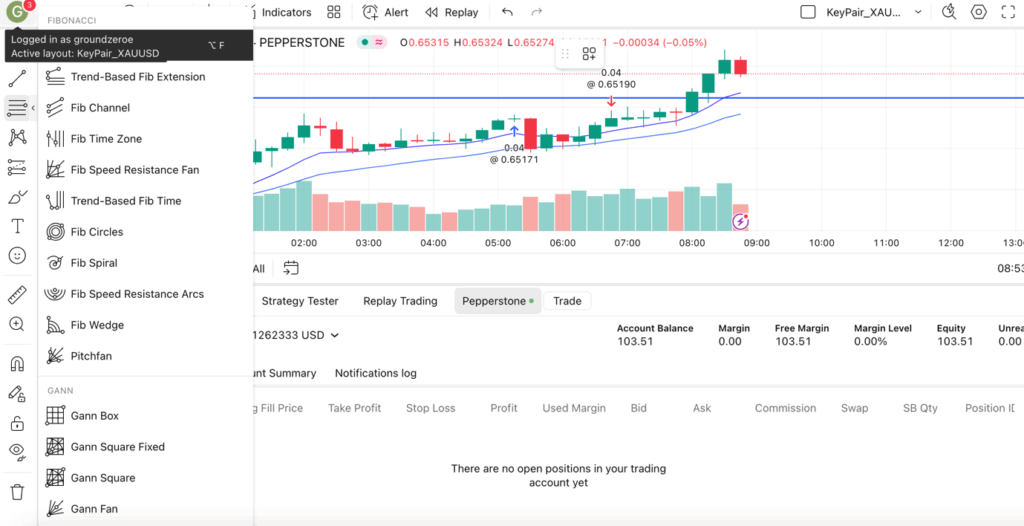
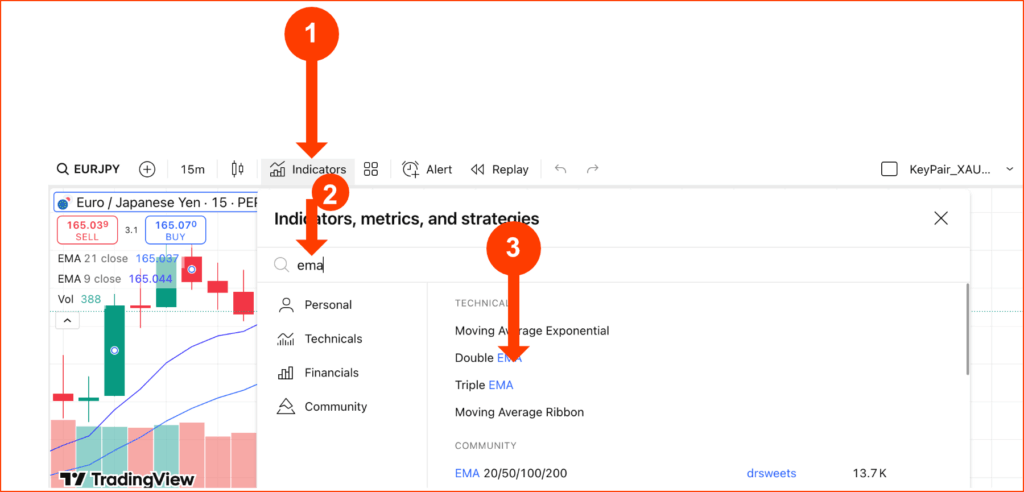
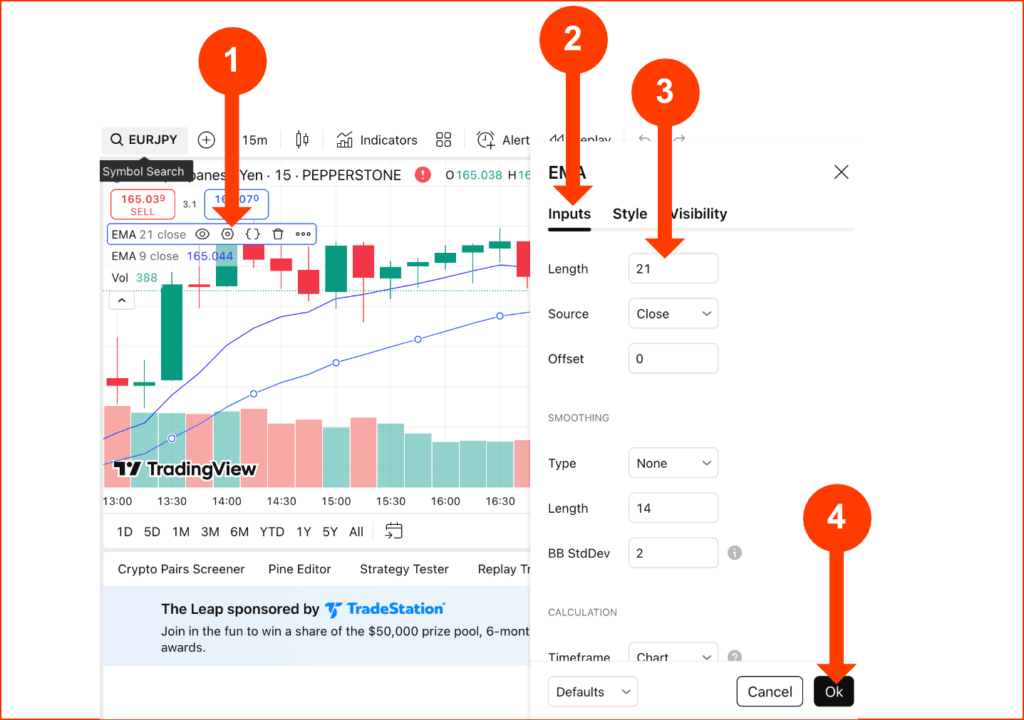
The image below is a TradingView screenshot showing how to select ema 9 and ema 21 indicators in TradingView.
The graphic below illustrates how you can set the EMA 21 indicator in TradingView
Step 2: The Zone
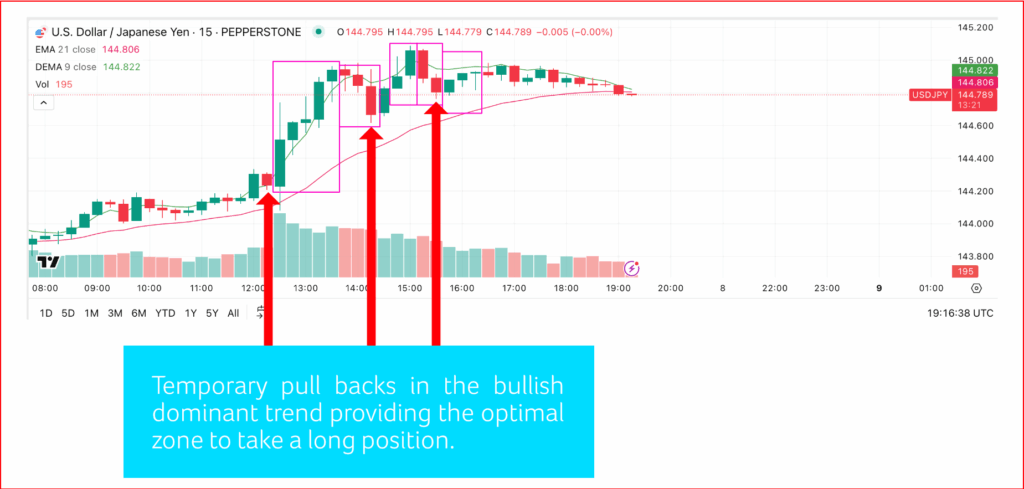
So here is the confusing part – once you have identified your dominant trend e.g. Bullish (ema 9 is over ema 21) you need to wait for the zone. The zone is the best or optimal place to enter the market or to take a position. So the bit of confusion comes from the fact that if you are taking a Long position (Bullish), you need to wait for the low end of that bullish momentum and catch the upward bullish spell when it is just starting. This is your Zone.
Your zone is when there is a temporary pullback from that bullish momentum and the pushback touches either the EMA 9 or EMA 21.
See the chart below that illustrates the right place to enter a bullish position based on price action.
Many beginner traders overlook the importance of this and wind up losing a lot of money. Identifying and respecting the zone is critical for 2 things:
- It gives your position high probability for distance so that your profits are stretched and worthwhile – makes your positions worth it
- Enables you to avoid jumping onto a bullish spell midday – risking losing money should the momentum reverse especially if the trend is nearing exhaustion of indecision. So respecting the zone enables you to avoid Fomo trading where you are chasing a winning direction that has long bolted. Part of the important traits of successful traders is the emotional intelligence to sit back and avoid jumping in even if it looks like you are missing out on a favourable spell.
Key Rules for analysing the zone:
- You’re looking for price to retrace and touch EMA 9 and EMA 21
- The greater the distance between EMA 9 & 21 before price retraces → stronger the momentum build-up.
Tips:
- Avoid congested zones (previous choppy price action)
- Volume should ideally taper off as price retraces (indicating profit-taking, not reversal)
Step 3: The Setup
So you got your dominant position right and you have been patient enough to wait for the price to pull back to the Zone. Great Stuff. Now comes the fun stuff – waiting for the set up.
In the set up – we are looking for signs that the pullback is temporary and our dominant trend will resume.
What to watch for:
- Shrinking candles — body size getting smaller as price approaches EMAs
- Wicks on both ends = indecision
- Volume drop-off
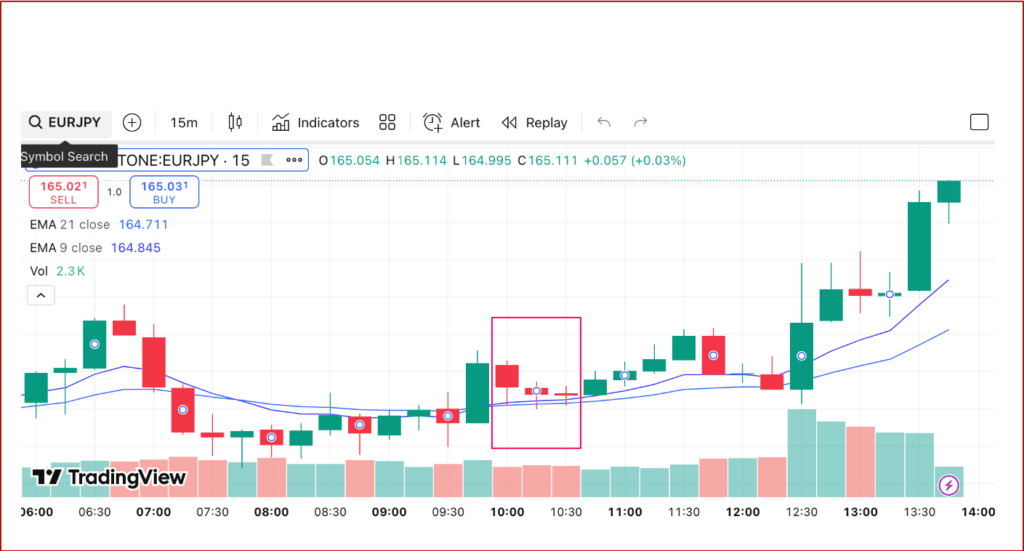
The graphic below illustrates the shrinking candles that signal the pull back’s loss of momentum.
Other than the shrinking candles above – you need to watch for other candle patterns that signal momentum loss such as:
- Doji candles
- Inside bars
- Spinning tops
- Bearish/Bullish pin bars
- Multiple consecutive small-bodied candles
Step 4: Confirmation
So far so good, we are in the zone and we’re set up (perhaps with shrinking candles) – now we need to be careful here- this is where most beginner traders lose – before you jump onto a position based on the set up only – you need to wait for the confirmation of the dominant reversal.
What you need to wait for:
Engulfing candle in trend direction (body engulfs the previous candle’s body)
- Volume increase on this candle
- EMA 9 and 21 maintaining or increasing spacing
Trade Decision:
- If it ticks those boxes, it’s your cut to enter.
Step 5: Risk Management
Now that we are good to go – we are in the zone, the set-up is in place and it’s confirmed – now it’s time to enter the market. Risk management involves positioning your Stop Loss (SL) as well as your Take Profit (TP) strategically.
Positioning Your Stop Loss
Options for placing your stop loss:
- Below the previous swing low wick (conservative) – below the wick of the previous low swing candle.
- Below the body of the engulfing candle (aggressive — tighter SL, better R:R)
Tip: If the price structure is clean, use wicks. In congested markets, bodies work better.
I have also observed that trading the 15m chart gives you a better perspective of the range of the price fluctuations even within a particular dominant trend.
If you place your SL too tight you might incur unnecessary losses caused by the natural up and down movements of the price even in its upwards (bullish) pattern – so you need to protect your position from such.
You also need to pay attention to the momentum of the trend and the range of its fluctuations just to keep your SL tight while not risking getting it hit by the expected dips that are part of price action.
Positioning Your Take Profit
Options for positioning your TP:
- Previous high/low
- Nearest significant support/resistance
- 1:2 or 1:3 Risk: Reward Ratio (as a rule of thumb)- this means that if you are risking $10 in your trade you set the TP at $30
Pro Tip Advanced:
Trail your stop manually as price moves in your favour, locking in profits.
As you observe your position and you see the bullish trend surge up in your favour – you want to ensure your winning trade runs for as long as possible while you keep reducing risk that comes with that. The best way to do this is to trail your stop loss to lock in profits.
So if your stop loss is at -$10 – and now your position has spiked to +$15 profits – instead of closing it or just watching from the side-lines you can move to stop loss up to +$5 – +$10 and lock in those margins. What this does is it locks in profits and eliminates any loss while it keeps your winning position running and positioning you for more profits should the trend continue in your favour.
You may also need to check for trend exhaustion and momentum to ensure that while your trading strategy is confirmed you are not entering the market at the wrong time. For this you may need indicators like volume, the Relative Strength Index (RSI) or
Understanding Market Orders and Limit
As you are setting out to master forex trading, some of the important concepts you need to grasp early enough include market orders and limit orders. What are these and what is the difference?
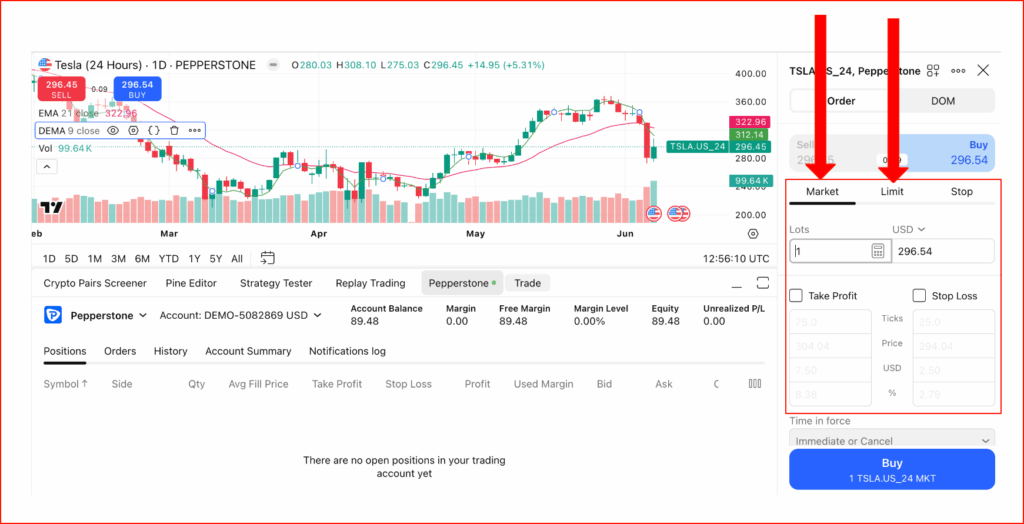
Market Orders
Market orders enable you to execute your positions instantly on the current price – this means you’re in as soon as you execute this order. You just need to watch out for possible slippages in volatile markets.
Limit Orders
Limit orders are set to be triggered at a specific price. These tend to give better grip on price but they might miss the trade if price moves too fast.
Which is Better for Scalpers?
If you are a scalper you want to consider making use of market orders so that you can move and position instantly post confirmation. Limit orders can be useful for pre-set retracements, but during breakouts or fast trend resumption, market orders win.
If you want to explore all these concepts my charts are based on my personal experiences using Pepperstone integrated with TradingView. So Pepperstone is my broker (where my money sits) and TradingView is a charting platform – great for price action analysing and tooling.
TradingView free plan allows double ema (you can make one EMA 9 and another EMA 21) – the plan also allows you to place a volume indicator as well. TradingView is available on web (browser), desktop and mobile.
Pepperstone offers tight spreads, something essential for scalping. You also get a wide asset range (Forex, CFDs, indices and commodities.
Contracts for Difference (CFD) trading lets you trade after regular hours giving you access to either learn (on paper money) and trade with real money if it works for you. However you should note that momentum is usually lower outside main trading sessions.
Final Thoughts
I hope the post has demystified price trading for you. You just need to follow these 5 steps outlined above, remember to use other indicators like RSI and volume to avoid jumping in when the trend is getting exhausted and the market is generally losing momentum which might land in your risky positions or dead trade that drag on and on without much prospects.
Remember to keep a journal for all trades, your wins, losses and set ups. This is critical for reviewing and improving your strategy.
Try out this strategy on a demo account with TradingView Basic tier account (Free) and Pepperstone Demo trading account (risk free).
82% of Nvidia’s gains between March 2024 and February 2025 took place outside of regular Nasdaq trading hours. This was made possible through Contract for Difference assets (CFDs).
Pepperstone offers CFDs on 100+ US shares 24 hours a day giving you unlimited access to the market to perfect your craft.
Trade Smarter with Pepperstone

Pepperstone
Elias Stroud is a professional forex trader and market analyst with over eight years of experience. His journey began with the common misconception that trading was a get-rich-quick scheme, a path that led to significant early losses. It was this initial failure that forced a pivot towards disciplined, long-term learning and strategy development.
Today, Elias specializes in price action analysis, focusing on identifying high-probability setups without relying on complex indicators. He has cultivated a premium-level trading account, a direct result of his commitment to a structured and professional approach to the markets. Elias is passionate about sharing the actionable insights and foundational principles that helped him transform from a novice to a consistently profitable trader.
For further verification of his professional standing and live trading credentials, please visit the “About Us” page where account confirmation screenshots are provided, along with links to his trusted broker, Pepperstone, and his primary charting platform, TradingView.