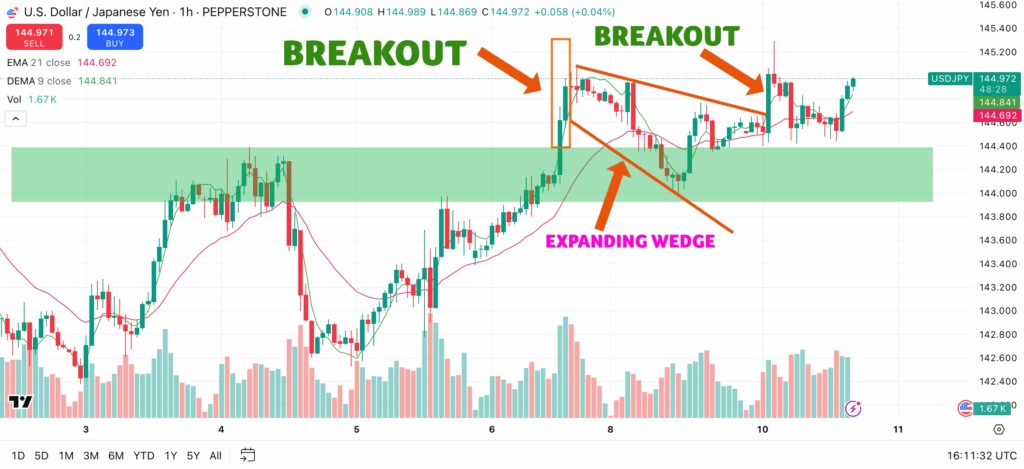
Screenshot from my 10 June 2025 Trading Pepperstone USDJPY Trading Setup
My trade Journal for the USD JPY Pair – 10 June 2025
| Trading Strategy | Breakout Trend Continuation Strategy |
| Dominant Trend | Bullish (EMA 9 running about EMA 21) |
| The Zone | Breakout candle formed from the EMA 9 going up |
| The Set Up | Breakout candle engulfing previous pin bars |
| The Confirmation | Follow Up well bodied bullish candle confirming upward bullish momentum |
| Risk Management | Stop loss below the wick of previous low Take Profit on the previous resistance region around the break out high |
| Charting Platform | TradingView |
| Broker | Pepperstone |
The USDJPY currency pair is one of the most volatile and profitable currency pairs to trade. The pair often presents clean, and tradeable technical setups that make it one of my favourite pairs to trade – after the Gold and USD (XAUUSD) pair.
For this pair, just like other volatile pairs – more often, you will get a classic scenario playing out – such as a resistance level is broken, then followed by a retest and continuation—a sequence that recently unfolded in this pair. The picture above is a screenshot taken on the 10th of June 2025.
In a textbook move, USDJPY:
This price action and behaviour is not unusual and offers important insights for an avid trader. You can observe how support-resistance dynamics, pattern recognition, and volume timing can work together for high-probability trade setups.
Entering your trade set at the time after the confirmation of the breakout would position your long position for distance and exponential gains.
What Is the Most Effective Price Action Strategy for USDJPY?
Among various price action methods, break trend continuation or breakout–retest setups are particularly effective on the USDJPY pair. These work great when:
- A strong breakout occurs from a clear pattern(e.g., wedges, flags, etc)
- The breakout is followed by a clean retest of the former resistance as new support.
- Price action confirms the set up with the bullish momentum that shows up through candles or volume spikes.
What makes this strategy powerful is the combination of the market structure, confirmation, and momentum, which gives you as a trader high quality and high probability trade setups.
This also aligns well with the typical behaviour of the USDJPY and its price action patterns which are often—clean, decisive, and often news-driven.
What Is the Best Session to Trade USDJPY?
The best time to trade USDJPY is during the Tokyo–New York overlap (08:00–11:00 EST). This window brings liquidity, volume, and increased volatility—ideal for executing price action setups.
How to Trade USDJPY Successfully
If you want to get in the terrain of trading the USDJPY successfully you need to ensure the following:
- Use higher time frames (Weekly, 1D, 1H) to map the dominant trend and use lower time frames for confirmation and for trade entry.
- Focus on chart patterns like wedges, triangles, or consolidation zones.
- Use horizontal levels as well as trend lines as key decision points.
- Watch for breakout and retest setups with strong candle confirmations.
- Align trades with high-volume sessions and key economic events (e.g., NFP, BoJ statements).
How to Read USDJPY Price Action Charts
When reading the USDJPY price action charts the key elements to track are:
Swing highs/lows (peaks & troughs showing trend direction)
Candlestick patterns (engulfing, pin bars, inside bars at key levels)
Volume spikes at critical price zones
Confluence of Fibonacci levels with price structure
USDJPY often respects Tokyo session opening price – mark this level daily on your chart.
USDJPY Support and Resistance Price Action
The best practices for profiting from the USDJPY Support and Resistance Price Action involve identifying clear swing points from H4/Daily charts first and watching for price compression (tight ranges) near key levels. You can then validate these with 61.8% Fibonacci retracements as well as previous day high/low round numbers (e.g., 158.00, 159.00).
Key Behavior To Watch: USDJPY frequently tests levels 3 times before breaking – journal these retests.
Best USDJPY Price Action Trading Strategy
When trading the USD/JPY currency pair, the London-Killzone Breakout is a high-probability setup that capitalizes on the volatility shift between Asian and London sessions.
Below is how it works:
Mark the Asian Session Range. You do this by identifying the high and low of Tokyo trading hours (typically 12AM–9AM GMT). This range often acts as a springboard for London session moves.
Trade the Breakout with Momentum when London traders enter (8AM GMT). Look for a surge in volume and price breaking the Asian range.
As always – we never make trade decisions based on isolated signals or indicators. So you will need to confrim these with Filters and only take trades where:
Price holds above/below the 200EMA on the 15M chart
Volume exceeds the 20-period average
A 1H candle closes decisively beyond the range (avoid wick-only breaks).
Why It Works for USD/JPY
This approach works for the USDJPY pair because the pair frequently consolidates in Asia before trending in London. The 200EMA acts as dynamic support/resistance, while volume confirms institutional participation.
USDJPY Breakout Trading Strategy
The other high-probability setup for the ESDJPY pair is the Breakout Trading Strategy.
With this strategy you need to Wait for consolidation after news events (NFP, BoJ meetings) and then enter on break of 1H candle close beyond 20-period Bollinger Band. You then need to measure initial move for 1:1.5 RR minimum.
For your sik management you need position your stop loss at the 1.5x ATR(14) and take partial profits at previous swing point. You can trail stop loss to breakeven after +15 pips.
What Moves the USDJPY?
One common question around this pair is, What Causes USDJPY to Go Up?, Like any currency pair in the forex market, there are several macro and technical factors driving this price movement for this pair. In the main – these include:
- Interest rate differentials between the U.S. and Japan.
- U.S. dollar strength or weakness driven by inflation and Fed decisions.
- Risk sentiment shifts—JPY is a traditional safe-haven.
- Carry trade flows, where investors borrow low-yielding JPY to invest in higher-yielding USD assets.
Frequently Asked Questions
What is the best time to trade USDJPY in South Africa?
Between 2 PM and 5 PM SAST, aligning with the active New York session which runs from 8am to 5PM New York Local Time — Eastern Time / ET
How much is 1 pip in USDJPY?
- Standard lot (100,000 units) = ~$9.13 USD per pip.
- Mini lot (10,000 units) = ~$0.91 USD per pip.
How to calculate lot size for USDJPY?
To Calculate Lot Size for the USDJPY you can use this formula:
Lot Size = (Account Risk in $) ÷ (Stop Loss in Pips × Pip Value)
What correlates with USDJPY?
- Positive correlation: USDCHF, Nikkei 225.
- Negative correlation: Gold, sometimes EURJPY.
Final Thoughts
The USDJPY offers strong trade opportunities like breakout setups and many others that intraday traders, swing traders and even long strategy traders can exploit. The bullish trend is one of my favourite runs to exploit although I do trade its reversal sometimes.
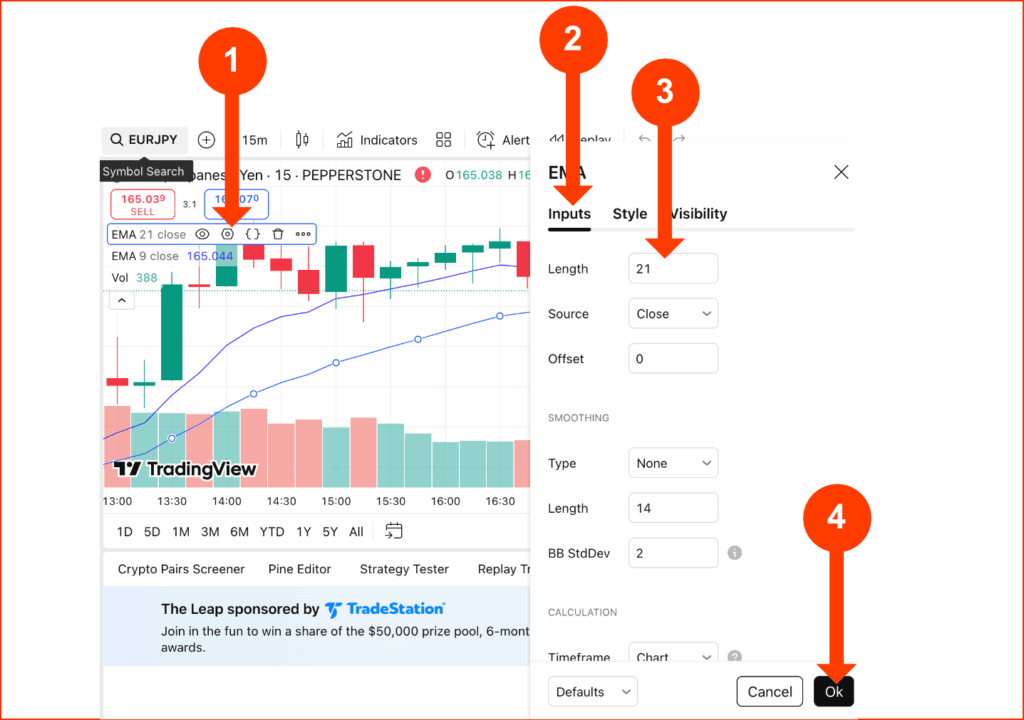
Using the Breakout Trend Continuation Strategy — with EMA 9 above EMA 21, breakout engulfing candles, and solid follow-through confirmations — provides a reliable framework for identifying high-probability entries that also give your position distance for meaningful profits.
Pro Tip: Never take action on any chart patterns or indicators blindly and in isolation of other critical market factors. Wait for confirmations for your set ups and adopt a multivariate approach to decision making.
Risk management remains essential. You need to set stop losses below recent lows and set up take profits around previous resistance zones or breakout highs.
Trade with Reputable Platforms
For execution, the Pepperstone (tight spreads, fast execution) and TradingView combo works well for me. These are not the only options you have though. Other reliable options include IC Markets and BlackBull Markets for traders seeking additional alternatives with raw spread accounts.
Remember nothing worthwhile is mastered overnight – stay patient, don‘t give up – learn with paper money, trade only money you can afford to lose.
The thumb rule is to let market structure lead, and always trade what you see – if it is tradeable at all (in other words, if it aligns with your strategy). Don’t come to the market to force your plan on conditions that are not conducive.
All the best in your trading journey.
Trade Smarter with Pepperstone

Pepperstone
Elias Stroud is a professional forex trader and market analyst with over eight years of experience. His journey began with the common misconception that trading was a get-rich-quick scheme, a path that led to significant early losses. It was this initial failure that forced a pivot towards disciplined, long-term learning and strategy development.
Today, Elias specializes in price action analysis, focusing on identifying high-probability setups without relying on complex indicators. He has cultivated a premium-level trading account, a direct result of his commitment to a structured and professional approach to the markets. Elias is passionate about sharing the actionable insights and foundational principles that helped him transform from a novice to a consistently profitable trader.
For further verification of his professional standing and live trading credentials, please visit the “About Us” page where account confirmation screenshots are provided, along with links to his trusted broker, Pepperstone, and his primary charting platform, TradingView.