GBPUSD Live feed courtesy of TradingView.
My trade Journal for the USD JPY Pair – 16 June 2025
| Trading Strategy | Breakout Trend Continuation Strategy |
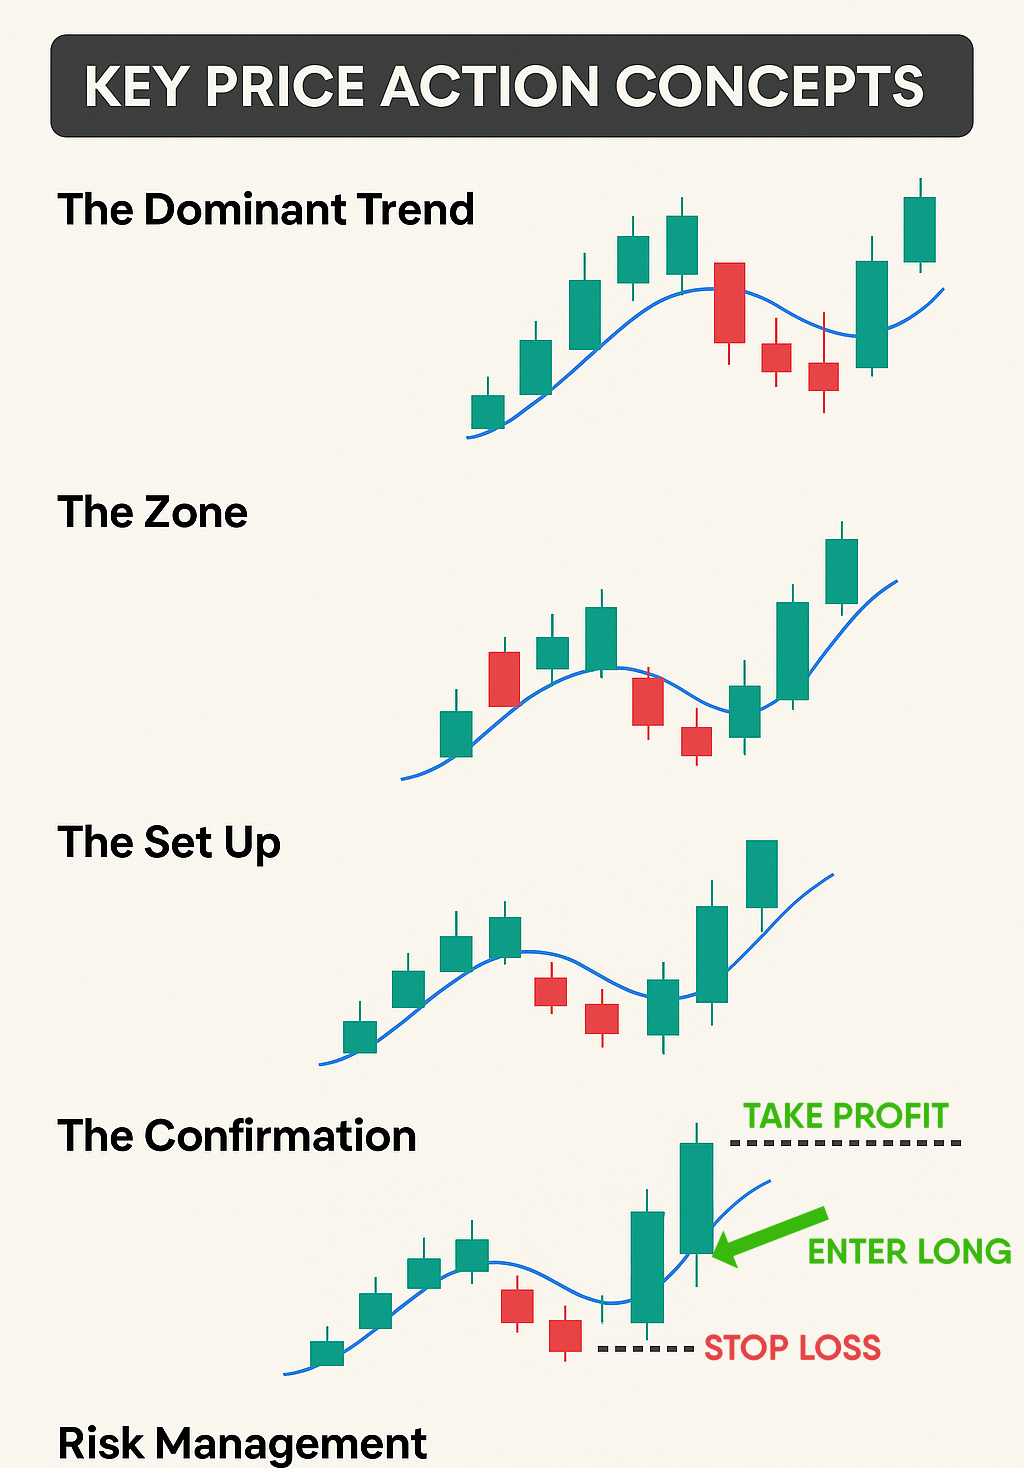
| Dominant Trend | Bullish (EMA 9 running about EMA 21) |
| The Zone | Breakout candle formed from the EMA 9 going up |
| The Set Up | Breakout candle engulfing previous pin bars |
| The Confirmation | Follow Up well bodied bullish candle confirming upward bullish momentum |
| Risk Management | Stop loss below the wick of previous low Take Profit on the previous resistance region around the break out high |
| Charting Platform | TradingView |
| Broker | Pepperstone |
Today’s London session presented two clean GBPUSD price action trading opportunities, marked by textbook rejections at supports and clean bullish engulfing setup on the 1-hour chart.
This is my trading journal blog where I share some key exploits in the forex trading journey. In today’s entry I’ll break down the key insights, strategy execution, and outcome of the trade – with the aim of driving home some key GBPUSD price action trading strategies.
GBPUSD Price Action Trading Strategies
So the bit I have learnt about trading the GBPUSD is that understanding how price reacts at key levels is critical. This must be combined with other chart patterns and volatility expectations.
In the previous post I covered the importance of not taking a single signal or indicator in isolation of other critical factors and jumping onto the trade blindly. (This is how most beginner traders lose money).
Check out the post here: What is The Best Price Action Strategy – Simplified for Scalpers & Day Traders
In nutshell a meaningful trade decision context includes these 5 Critical Factors of Your Price Action Trading Strategy:
The GBPUSD pair is popular amongst forex traders owing to its sharp moves, especially during high-impact economic data releases and London/New York overlaps.
Key Techniques I Used in the Trade:
How to Trade GBPUSD Using Price Action
Chart Analysis: London Open (16 June 2025)
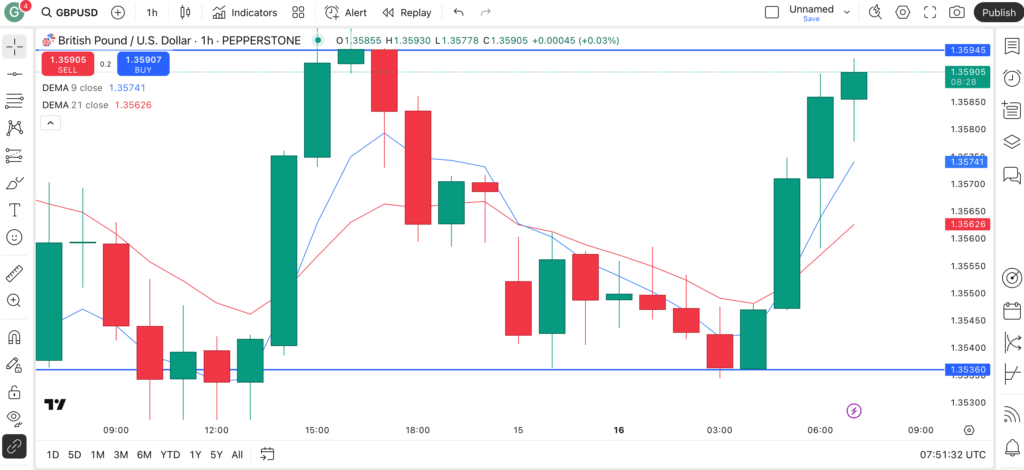
Below is the annotated GBPUSD 1H Chart Screenshot.
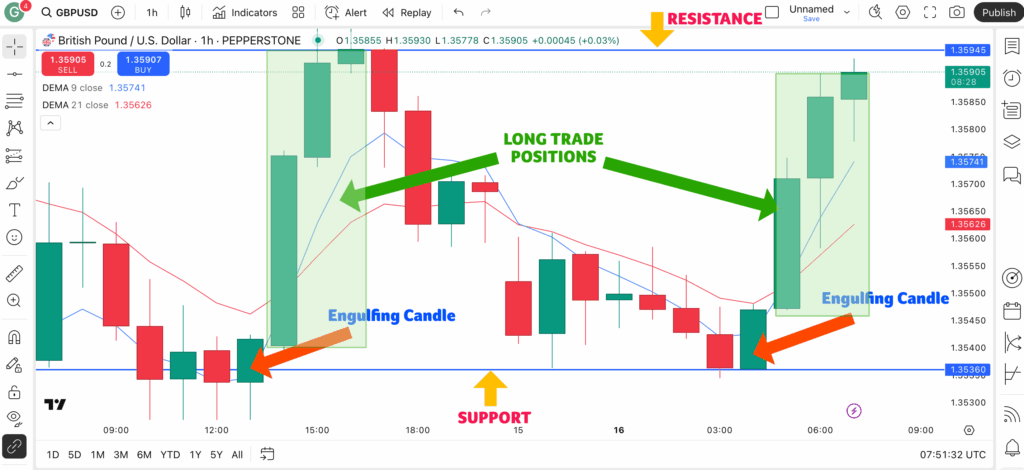
The screenshot above shows the two bullish engulfing and key levels marked- together with the Stop Loss and Take Profit levels.
Key Observations:
- Price bounced strongly off support at 1.35360, rejecting further downside.
- A clear bullish engulfing candles formed at 13:00 and 04:00. UTC, signaling buyers taking control.
- Price broke above both DEMA 9 (1.35741) and DEMA 21 (1.35626), confirming bullish momentum.
- Average True Range (ATR) indicated increased volatility, supporting a broader pip target.
Trade Execution
Best Timeframes for GBPUSD Price Action Trading
The best times to trade the GBPUSD pair using price action is when the market is the most volatile offering significant momentum of gains on well calculated positions.
Preferred Timeframes:
- 1-Hour (Main execution)
- 4-Hour (Trend context)
- Daily (Bias confirmation)
- 5-Minute / 15-Minute (For scalp setups at key levels or news events)
For this trade, the 1H chart gave a clean price action trigger post-London open.
GBPUSD Daily Chart Trading Strategy
Higher Timeframe Insight
Recent daily chart structure indicated a bounce after a 3-day decline. The bullish price action on the intraday chart aligned with this potential daily reversal. Part of the price action strategy was to focus on long setups on 1H and 4H while the daily structure holds above 1.35300.
Trade Summary
| Parameter | Value |
| Trade Type | Long |
| Entry Price | 1.35420 |
| Stop-Loss | 1.35300 |
| Take-Profit | 1.35945 |
| Risk-Reward | 1:2.5 |
| Reason for Entry | Bullish engulfing at support; EMA crossover; ATR-aligned volatility |
| Key Notes | Watch correlated pairs (EURUSD, USDCHF) for confirmation or divergence |
Key Drivers of the GBP/USD Pair
Economic Data Releases
One of the key and most consistent drivers of the GBP/USD movement are high-impact economic data releases from both the UK and the US.
These include central bank interest rate decisions, inflation figures, GDP reports, employment data (like the US Non-Farm Payroll and UK jobs numbers), retail sales, and PMI reports.
The economic events often trigger the sharp, directional moves of this pair.
Political and Geopolitical Events
GBP/USD is highly sensitive to political developments. Events like Brexit, UK general elections, US fiscal policy changes, or broader geopolitical tensions can impact the volatility of the pair.
In risk-off environments, traders typically buy the US dollar as a safe haven, causing GBP/USD to fall. On the other end, risk-on sentiment often benefits the pound.
Market Sentiment and Global Risk Appetite
Market mood is another factor with a significant bearing on the GBP/USD behaviour. When confidence rises and risk appetite improves, GBP/USD tends to rally as demand for the higher-yielding pound increases. Conversely, during risk-off phases, investors move to safer assets like the US dollar, pressuring Cable lower.
Correlations with Other Pairs and Assets
GBP/USD holds a strong positive correlation with EUR/USD (around +0.8) — the two currency pairs usually move together. The GBPUSD pair also maintains a negative correlation with USD/CHF (approximately -0.85).
This means that when GBP/USD rises, USD/CHF typically falls. There’s also a moderate correlation with gold (XAU/USD), especially during periods of US dollar weakness, though this link fluctuates depending on market conditions.
That said – these behaviours must be taken with a pinch of salt and within context because they may not always hold.
Volatility and Implied Volatility
GBP/USD is known for its volatility, averaging 80–120 pips daily, often outpacing other major pairs like EUR/USD. On my Pepperstone and TradingView integration I track volatility using the Average True Range (ATR) indicator.
As a trader you can also monitor implied volatility levels ahead of critical economic events to anticipate potential price swings and adjust risk management strategies accordingly.
Technical Setups and Price Action Patterns
Technicals play a vital role in GBP/USD trading strategies. Key setups include:
- Dominant trend identification via EMA crossovers (9 EMA over 21 EMA)
- Pullbacks within the EMA zone (the “Zone”) featuring consecutive red candles
- Loss of bearish momentum within the Zone
- Confirmation via a bullish engulfing candle
- Risk management using stop-loss below the recent wick and take-profit at the nearest resistance level
Additional reliable setups involve breakouts from consolidation ranges, reversal patterns like head and shoulders, and continuation formations such as flags and triangles.
Trade Smarter with Pepperstone

Pepperstone
Elias Stroud is a professional forex trader and market analyst with over eight years of experience. His journey began with the common misconception that trading was a get-rich-quick scheme, a path that led to significant early losses. It was this initial failure that forced a pivot towards disciplined, long-term learning and strategy development.
Today, Elias specializes in price action analysis, focusing on identifying high-probability setups without relying on complex indicators. He has cultivated a premium-level trading account, a direct result of his commitment to a structured and professional approach to the markets. Elias is passionate about sharing the actionable insights and foundational principles that helped him transform from a novice to a consistently profitable trader.
For further verification of his professional standing and live trading credentials, please visit the “About Us” page where account confirmation screenshots are provided, along with links to his trusted broker, Pepperstone, and his primary charting platform, TradingView.